Usage Metrics is a helpful tool that supports Power BI / Fabric report authors. This feature is primarily aimed at end users. It is useful wehn adopting a new solution and introducing the Power BI platform as a whole. It is nothing very complicated. It is a report that contains information about user visits to your Report. It is, therefore, a practical helper that can answer whether someone is using your Report. The Usage Metrics report has been a native component for a very long time and has undergone considerable changes, both the Report itself and also the dataset. For that reason, even today, we still have the option to switch whether we want the old or the new version.
Despite its usefulness, Usage Metrics has a few annoying pitfalls that have been publicly pointed out. I would like to discuss three of them, which I consider essential, a little more here:
- Data is kept in the dataset only for the last 30 days, so we lose all older data and cannot analyze the more extended consumption of our reports. !Unless we plan to write the values somewhere aside every 30 days!
- Usage Metrics are generated at the workspace level only and filtered to the Report from which it was opened using a filter in the filter pane. Yes, this filter can be removed and thus have a view of all reports in the workspace at once.
- Ownership of the dataset. For some reason, ownership, visibility, and access to the underlying dataset for a usage metric often change regardless of ownership of the workspace or the content inside.
- Sometimes you see it among other datasets, sometimes not.
- Sometimes, you can download it and modify it, and sometimes you can't.
- Sometimes, you access the dataset by going through the Report, and sometimes, it tells you that you don't have permission to do it, but you can ask the owner to grant you access. WHO IS THE OWNER?
Each point has its solutions, which may be different, but there is at least one standard solution. What kind? You must own the USAGE METRIC dataset that will hold data for as long as you want and across as many workspaces as you want. This is, of course, easy to say but more difficult to do.
Custom Usage Metric decisions
The initial decision is whether it is something we need globally across the entire organization, whether multiple content creators should view this data, or whether it needs a specific author or group of authors.
The next decision depends on whether we can access Admin permissions to get tenant-level events from the ActivityEvents API endpoint. This API also includes other activities such as viewing, editing, and opening of various Power BI artifacts. It can provide an even more excellent overview than the classic Usage Metrics report. Unfortunately, legally, permission to this API is quite often impossible to get in companies, because they require either the Power BI Admin / Fabric Admin user role (if I stick only within this system) or API Permissions "Tenant.Read.All" for Service Principals. These are very privileged permissions. If it is an internal need, then receiving these permissions can be much easier. Still, if you are, for example, a consultant supplying solutions, the probability that you will get them is minimal.
If we cannot receive these permissions, we need to solve this issue another way. I deliberately leave out the possibility of using some custom visual, which, during its rendering, will contact the specified HTTP endpoint, which will collect information about users. Yes, that would be an option. (Editor's note: If you want to see an article about this from Štěpán, let us know! We would be eager to ask him repeatedly for such a post.)
Another approach that is interesting from my point of view is to use the native resources offered by the Power BI Service. No matter what happens with the underlying dataset, it will always provide data, so you have the right to READ. In the same way, the prepared Report always offers you the possibility to modify it, so you even have the right to BUILD, which is the least privileged permission you need to be able to use the Execute Query endpoint and start sending DAX queries to the dataset. Of course, the possibility of using this unique endpoint must be enabled in the Admin settings of the tenant. Still, it is a much more minor complication than obtaining administrator rights for the entire Power BI / Fabric tenant.
Any service that can perform OAuth2 authentication against your AAD (Azure Active Directory / Entra) and thus obtain the Authorization token you need will serve you to use this endpoint. If you're looking for an easier way to do this, Power Automate and Logic Apps have built-in actions to call this endpoint:
- Run Query against Dataset
- Run JSON Query against Dataset
As part of these actions, you can log in classically and then send DAX queries as you like... Concerning the limits of this endpoint!!!
We can evaluate DAX queries against an existing Usage Metric dataset, which is handy if we have a several Workspaces where our content is stored. In short, we can go through each workspace and manually create the Usage Metrics report and dataset, save the dataset IDs with the WorkspaceID, and then set up a scheduler that extracts data from these datasets and stores the results somewhere. Then, it is up to us where it will be, what form we will give the data, and how we will solve the incremental refresh, retention, and visual aspects.
But what to do if we have, for example, 20 or 100 workspaces? It will take some time to review all these workspaces, create Usage Metrics, record the necessary IDs, and expand our download system. Even then, we have to repeat this procedure whenever a new workspace is added. We have to think about the fact that we want to get this information because, thanks to the 30-day retention of data in the native dataset, we can quickly lose data.
Automated creation of Usage Metrics
If a public endpoint existed within the Power BI / Fabric API to create these usage metric reports, everything would be more accessible. Unfortunately, this is not the case, and this endpoint is not part of the public API version 1.0. This leads us to question whether such a thing is even possible.
Yes, it is possible. After all, communication occurs between your browser and the Power BI Service in the background, whenever you do something in the web GUI. Most modern browsers provide the ability to view this communication. So, open DevTools within a browser such as Google Chrome, Microsoft Edge, or any other, activate communication recording, and try to request Usage Metrics from the Report. You can find a query that will look similar to the following: (Editor's note: This article has a good overview of using DevTools in a browser to inspect API calls.)
https://{clusteredURI}/beta/org/groups/{workspaceId}/usageMetricsReportV2
This query will be performed with the authorization token automatically created for you when you authenticate to the Power BI Service and held within your current session to the environment. Note that the Dataset or Report from which the invocation was initiated is not otherwise specified within that query. So, how does the filter get into the Report? Via a filter passed later as a parameter in the HTTP request.
To start the report creation process, you need to know the ClusterURI and ID of the workspace for which we want to create a usage metrics report or get information about the existing one (through the same query). The ClusterURI looks approximately as follows:
https://wabi-west-europe-d-primary-redirect.analysis.windows.net
ClusterURIs can be found in a variety of places. One of the easiest is by using a non-expanded dataset query:
https://api.powerbi.com/v1.0/myorg/datasets
The ['@odata.context'] attribute will be found within the response, which will contain the ClusterURI + its extension, which must then be removed so that the result looks like the mentioned template. But if, for example, you use the query "$top=1", then, unfortunately, the ClusterURI will no longer be returned within this attribute but "api.powerbi.com". So watch out for that because the usage metrics query doesn't work with this address and returns an error.
After executing the query, you will receive a response that is quite extensive and contains the ID of the Usage Metrics dataset as dbName:
response.json()['models'][0]['dbName']
We can implement this process in an automation script, which can go through all your workspaces on a schedule, find out if any new ones have appeared for which this query will need to be performed. We can also exclude a workspace so that it is no longer queried using the Execute Query endpoint, if we see that the query fails.
We must keep two conditions in mind which may cause difficulties with such an approach:
- The workspace is located in a suspended capacity (Pay-As-You-Go model). It does not matter whether it is Embedded or Fabric capacity.
- You are in the workspace as a Viewer.
Within these states, creating a Usage Metrics Dataset or obtaining information about an existing one is impossible. When asking in the first state, you will wait for a response, but it will not come from the server. So, it is good to implement a timeout. In the second state, an error message is returned.
When Fabric enters the scene
If you are looking for options where to store the obtained data, then you do not have to go far. We are talking about a smaller volume of records. In that case, if we don't need to maintain a more complex overview, we can use Push Dataset, for example, where we could push results from our DAX query, which would pre-aggregate values, for example, daily, for a report. Of course, we would lose a view of specific users, but this view can still be lost within the Power BI / Fabric environment (Admin Settings).
But if we want far more detailed data and keep it much longer, we can use, for example, the Fabric combination of Notebook + LakeHouse. The Notebook can be programmed to start automatically, and thanks to mssparkutils, it can also solve obtaining an authorization token. (Code below is Python.)
 pbi_resource = "https://analysis.windows.net/powerbi/api"

 def get_token():
    return mssparkutils.credentials.getToken(pbi_resource)

 authToken = get_token()
Additionally, all necessary libraries are available in the Fabric Notebook environment:requests and time. We use these libraries to make HTTP requests and wait appropriately between our requests. So, it provides all the means to ensure we can create a Dataset and then get it. If we combine the Notebook code executino with LakeHouse, in which we will store our data, we have quite an efficient combination that will provide us with everything we need.
I have prepared the code for a Notebook, here.
Everyone's needs are entirely different, so this is primarily a template you can expand with whatever you need. Currently, the Notebook solves the potential workload of the ExecuteQuery endpoint limit (120 queries per minute) and the reuse of already obtained Workspace IDs and Dataset IDs.
Here is a brief description of the work the Notebook does, and what you can expect using it yourself:
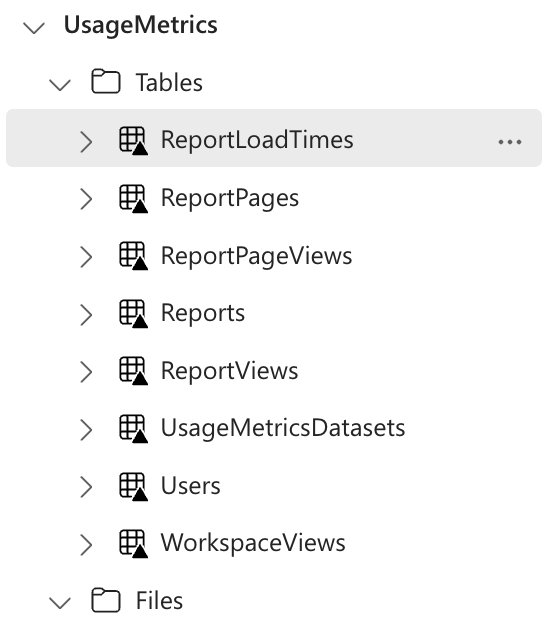
- The notebook will try to obtain information or generate a Usage Metrics Dataset for all available workspaces. If the creation is successful, the ID of the workspace and the ID of the Dataset are stored in a special Delta Table, "UsageMetricsDatasets" within LakeHouse to avoid unnecessary queries to the API that generates them. Subsequently, it sends DAX queries against the acquired datasets to obtain the individual tables that are stored in them and store the results in Lake House for subsequent use.
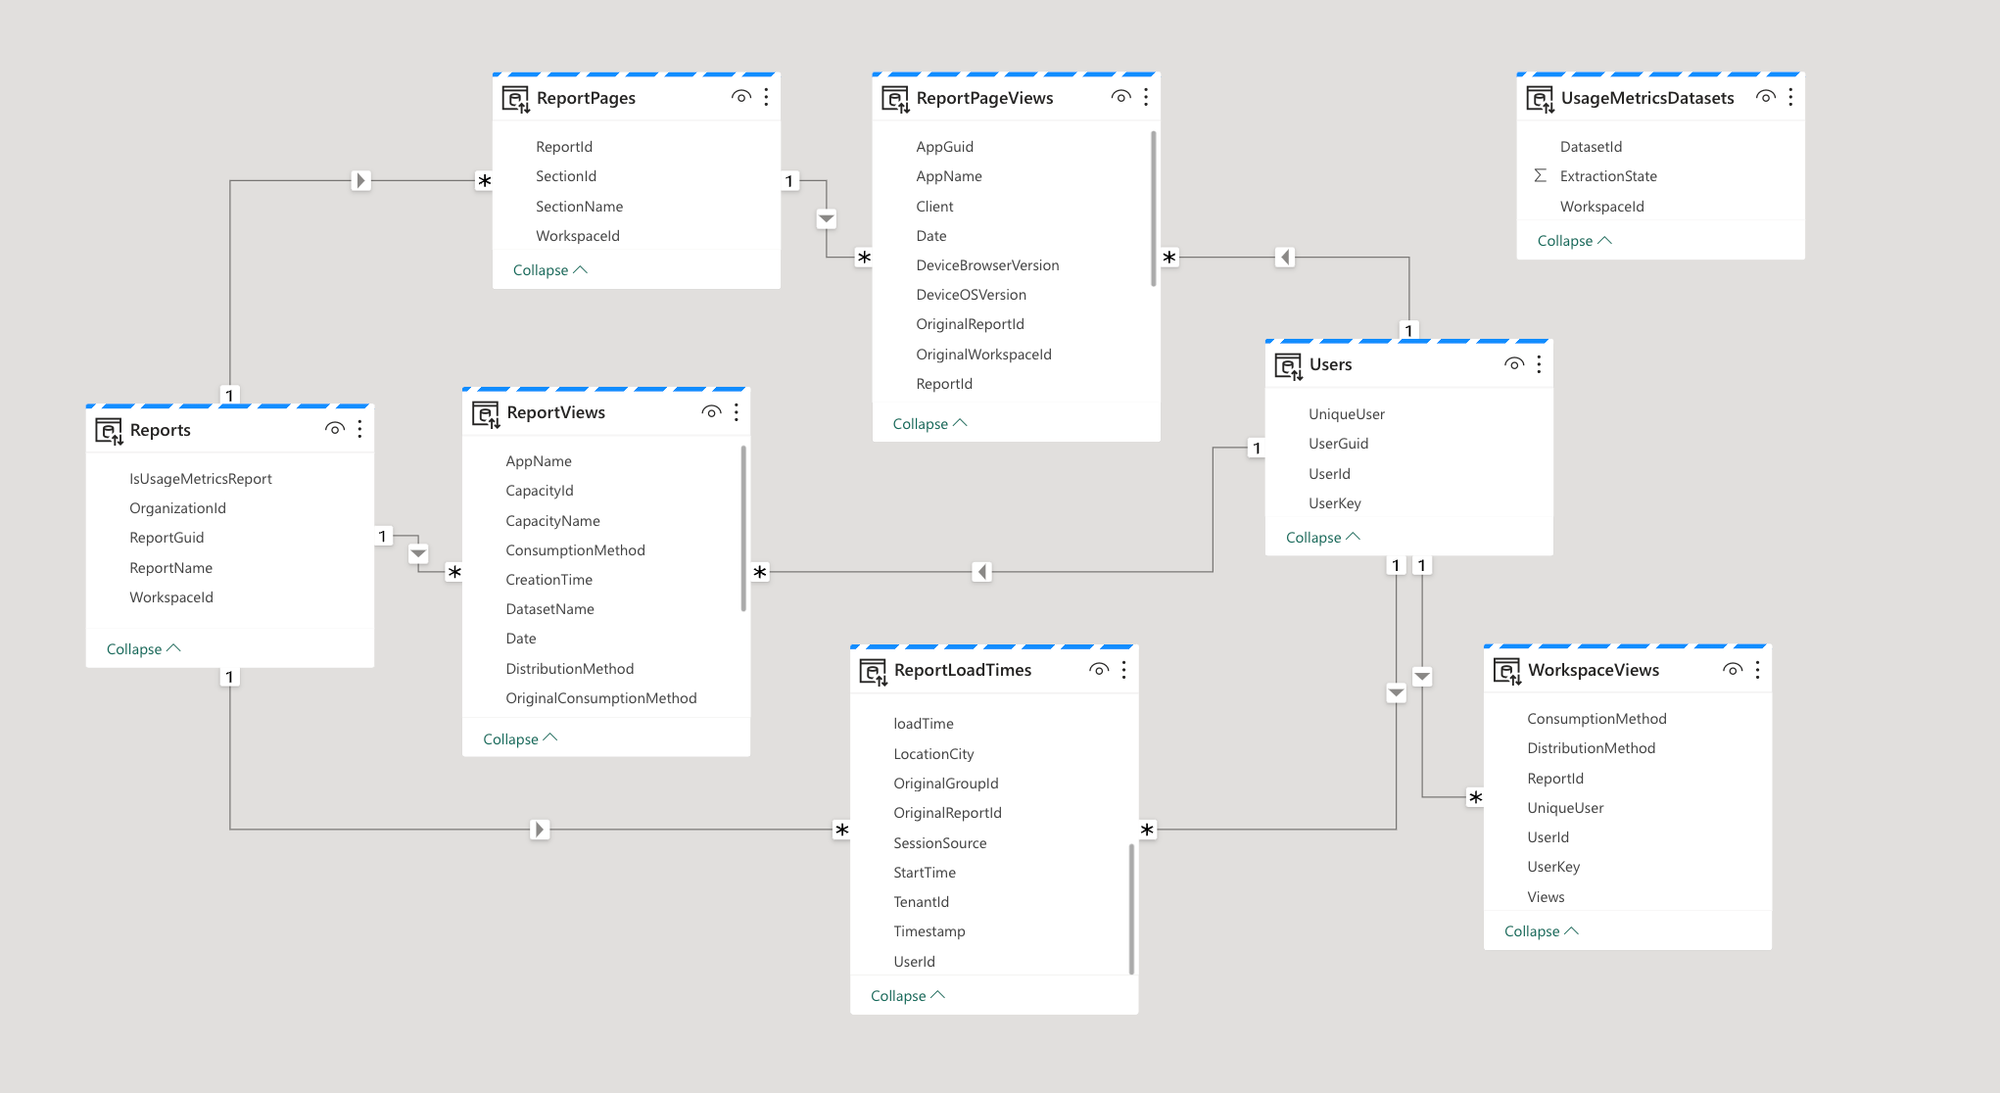
- After extraction, the result in Lake House will look like the images below. There are two main dimensions (Users and Reports); other tables can be connected to these.

Here are the relationships among the tables that will work in a Dataset.

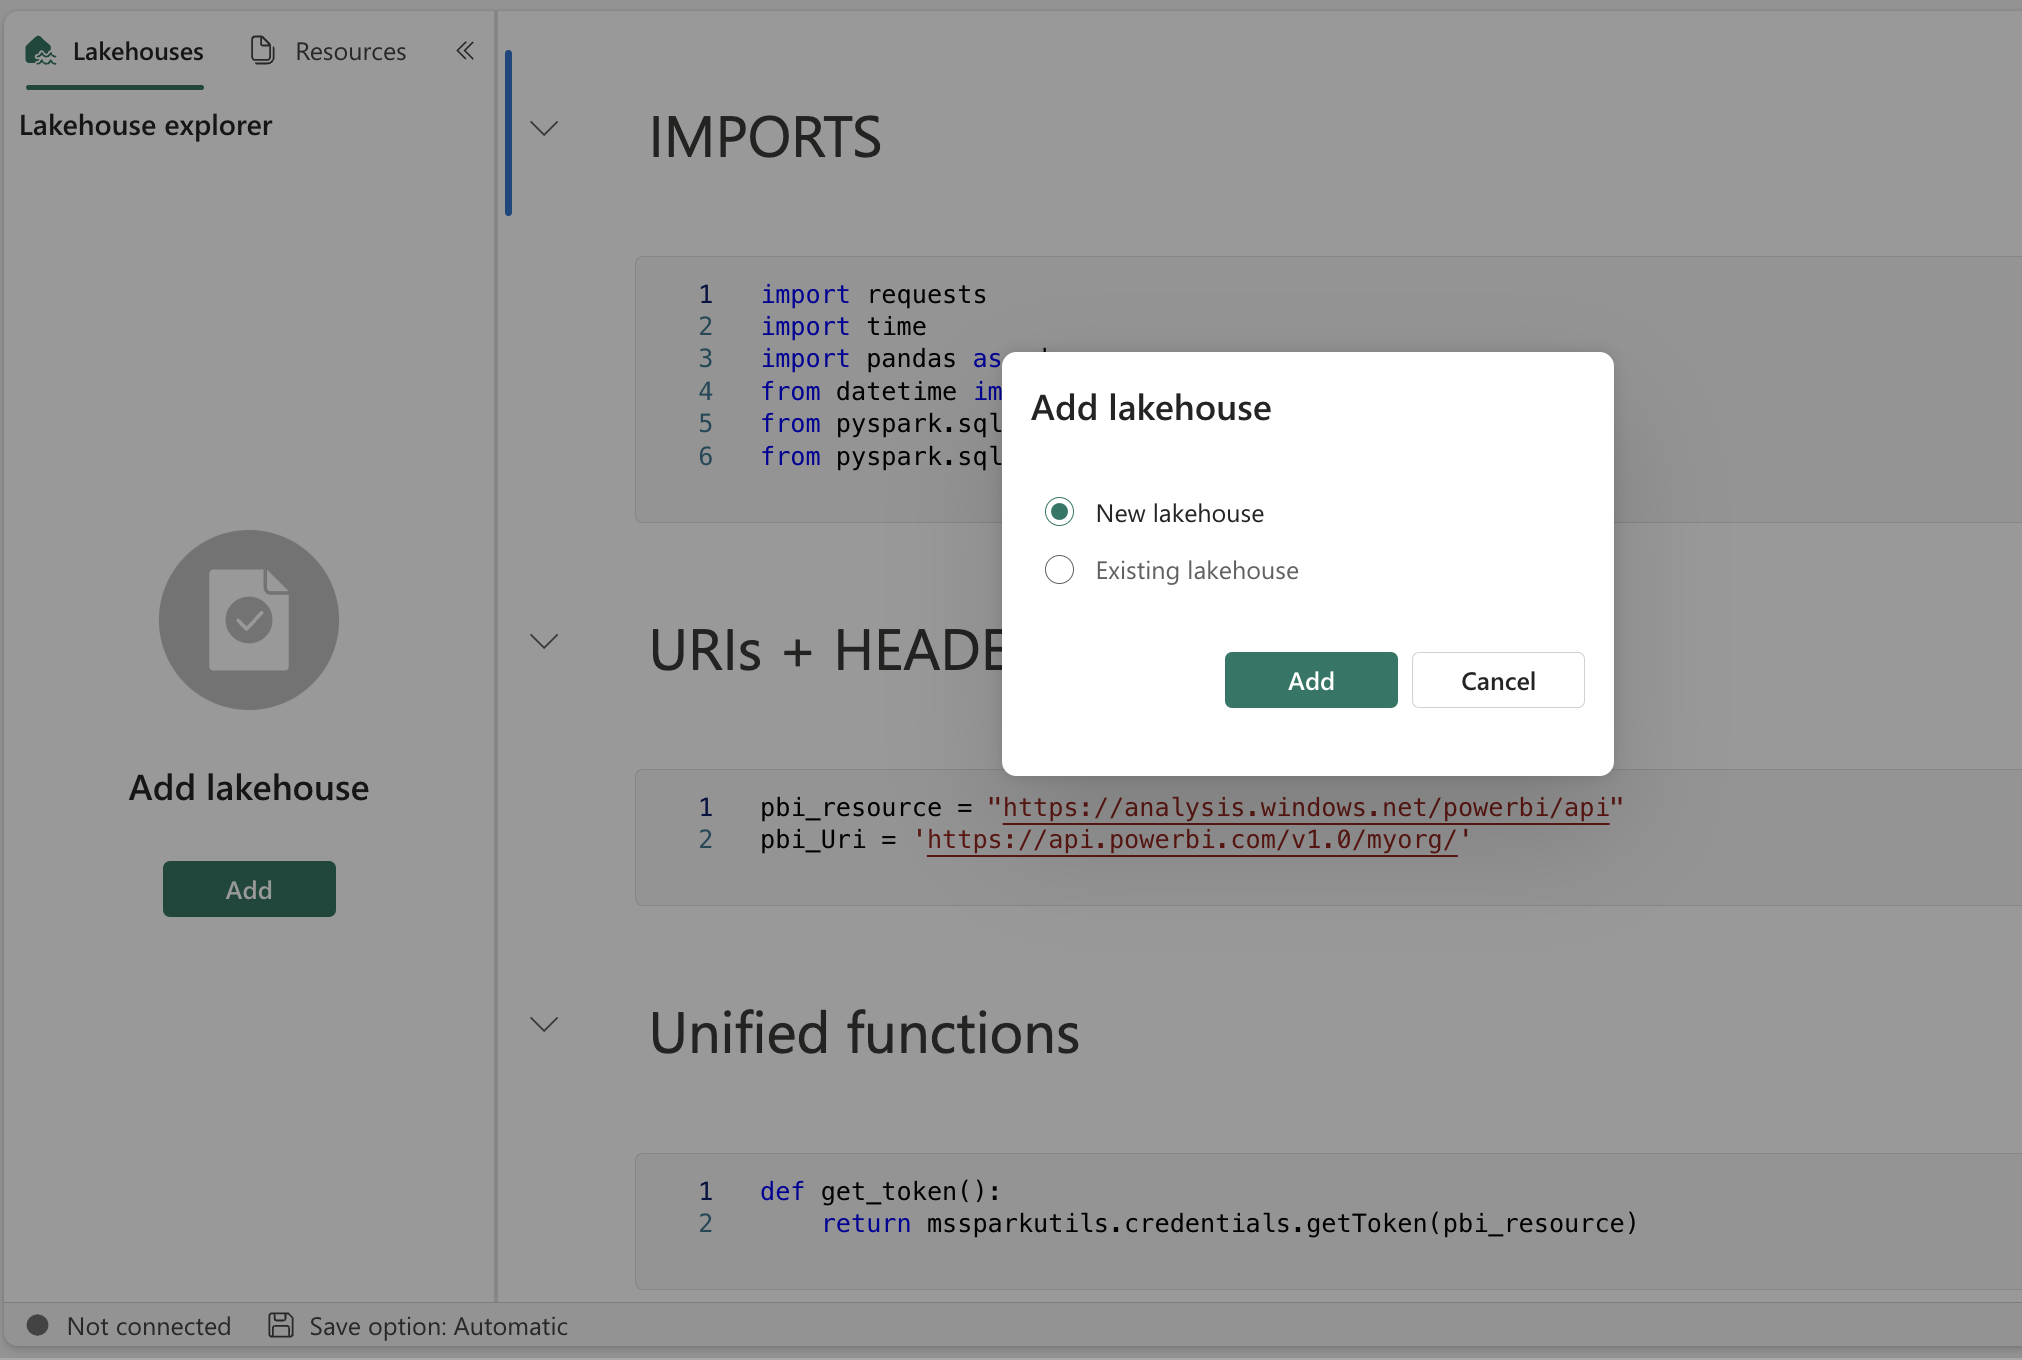
Implementing this notebook is very easy! In the Data Engineering mode of Fabric, you can use 'Import notebook' from a file. You can assign your existing Lake House or create a new one in the imported notebook. After assigning or creating one, you can just hit the "Run all" button, and the notebook will create all for itself. This is shown in the images below.


Summary
I believe we can agree that the most straightforward thing would be to acquire a better Usage Metrics Dataset (even for a fee so that we can have more data than just the last 30 days) with data across individual workspaces or a more direct way to get this data as developers without access to Admin resources. Given that the ActivityEvents API endpoint is behind Admin permissions, this is the best solution that can be implemented by an unprivileged user
Sponsored
Disclosure: the editors of Power BI Ops are partners and co-developers of this product. This sponsorship is by the editorial team. Štěpán, the author of the article, does not have a commercial interest in Argus PBI.
If you would like tenant-wide User Activity reporting with no set up, longer retention periods, and all activities included, check out Argus PBI.


