After a Power BI report has launched, there are some important questions. Who is actually using it? Is it reaching the intended audience? Is it being used more broadly than intended (yay!)? Or is it not being used at all (horror!)? As reports multiply, these questions grow in importance. And, as reports multiply, these questions become their own analytics challenge.
Who this article is for
This article is for anyone who needs to know how Power BI is being used within the organization, but is unlikely to write code to interact with the Power BI APIs. Sign up to keep up with us if you want to see more about API-based user activity reporting.
Why User Activity matters
Recently, one of our clients identified an issue in their source data that could affect all their Power BI reports. The first question they asked after identifying this issue was, "Which reports should be addressed first?" We can know this by the size and make up of the report audiences.
Power BI logs all Power BI and Fabric user activity: report views, data exports, API calls, everything. It can be provided back to you in various ways. We will focus first on the most common activities, report views, and the easiest methods to see these activities. Then show how to use some admin tools to get a look across workspaces.
Easy button for non-admins: the built-in usage metrics report and dataset
In every workspace, the Power BI Service can create a dataset for you, loaded with usage analytics specific to that workspace. However, it doesn't create that dataset by default; it only creates it the first time someone asks for it.
Creating the built-in usage metrics report
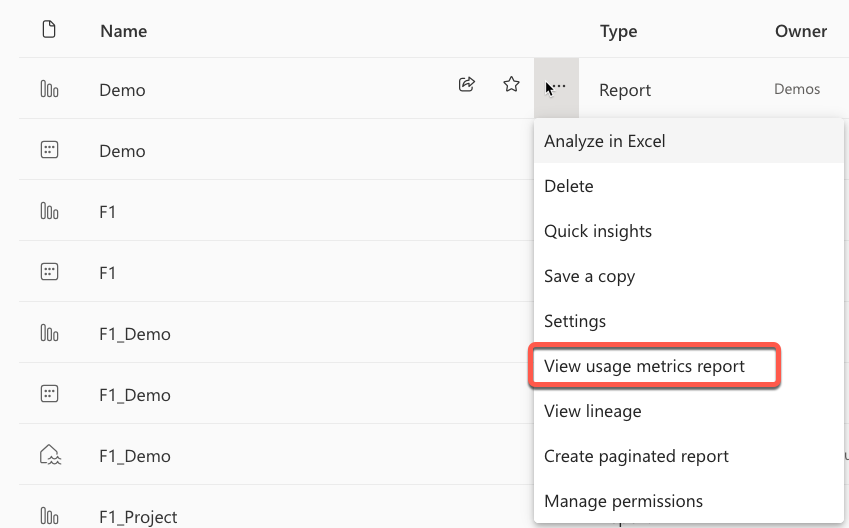
If no one has ever asked for a report in this workspace before, then a status box appears like this one.

The Power BI Service is creating a dataset for the first time. You won't see this dataset appear in the workspace's content list. The Power BI Service intentionally hides this dataset to keep the view clean and focused on user-generated content.
However, you can see the dataset through the workspace settings screen:
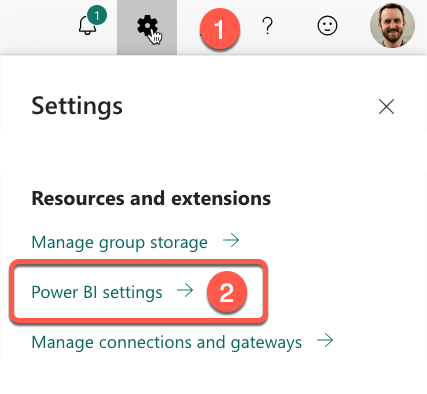
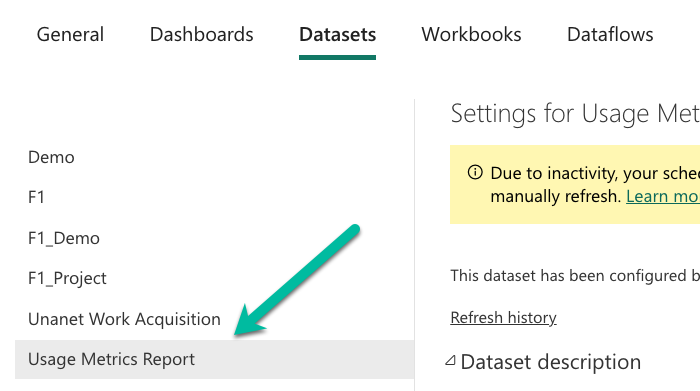
There it is listed under "Datasets".
You may have to wait up to 24 hours for this dataset to refresh itself, but once it does, the Power BI Service provides a nice summary report to show how reports in that workspace are used. You can get full details on the report and its meanings at the official docs here.
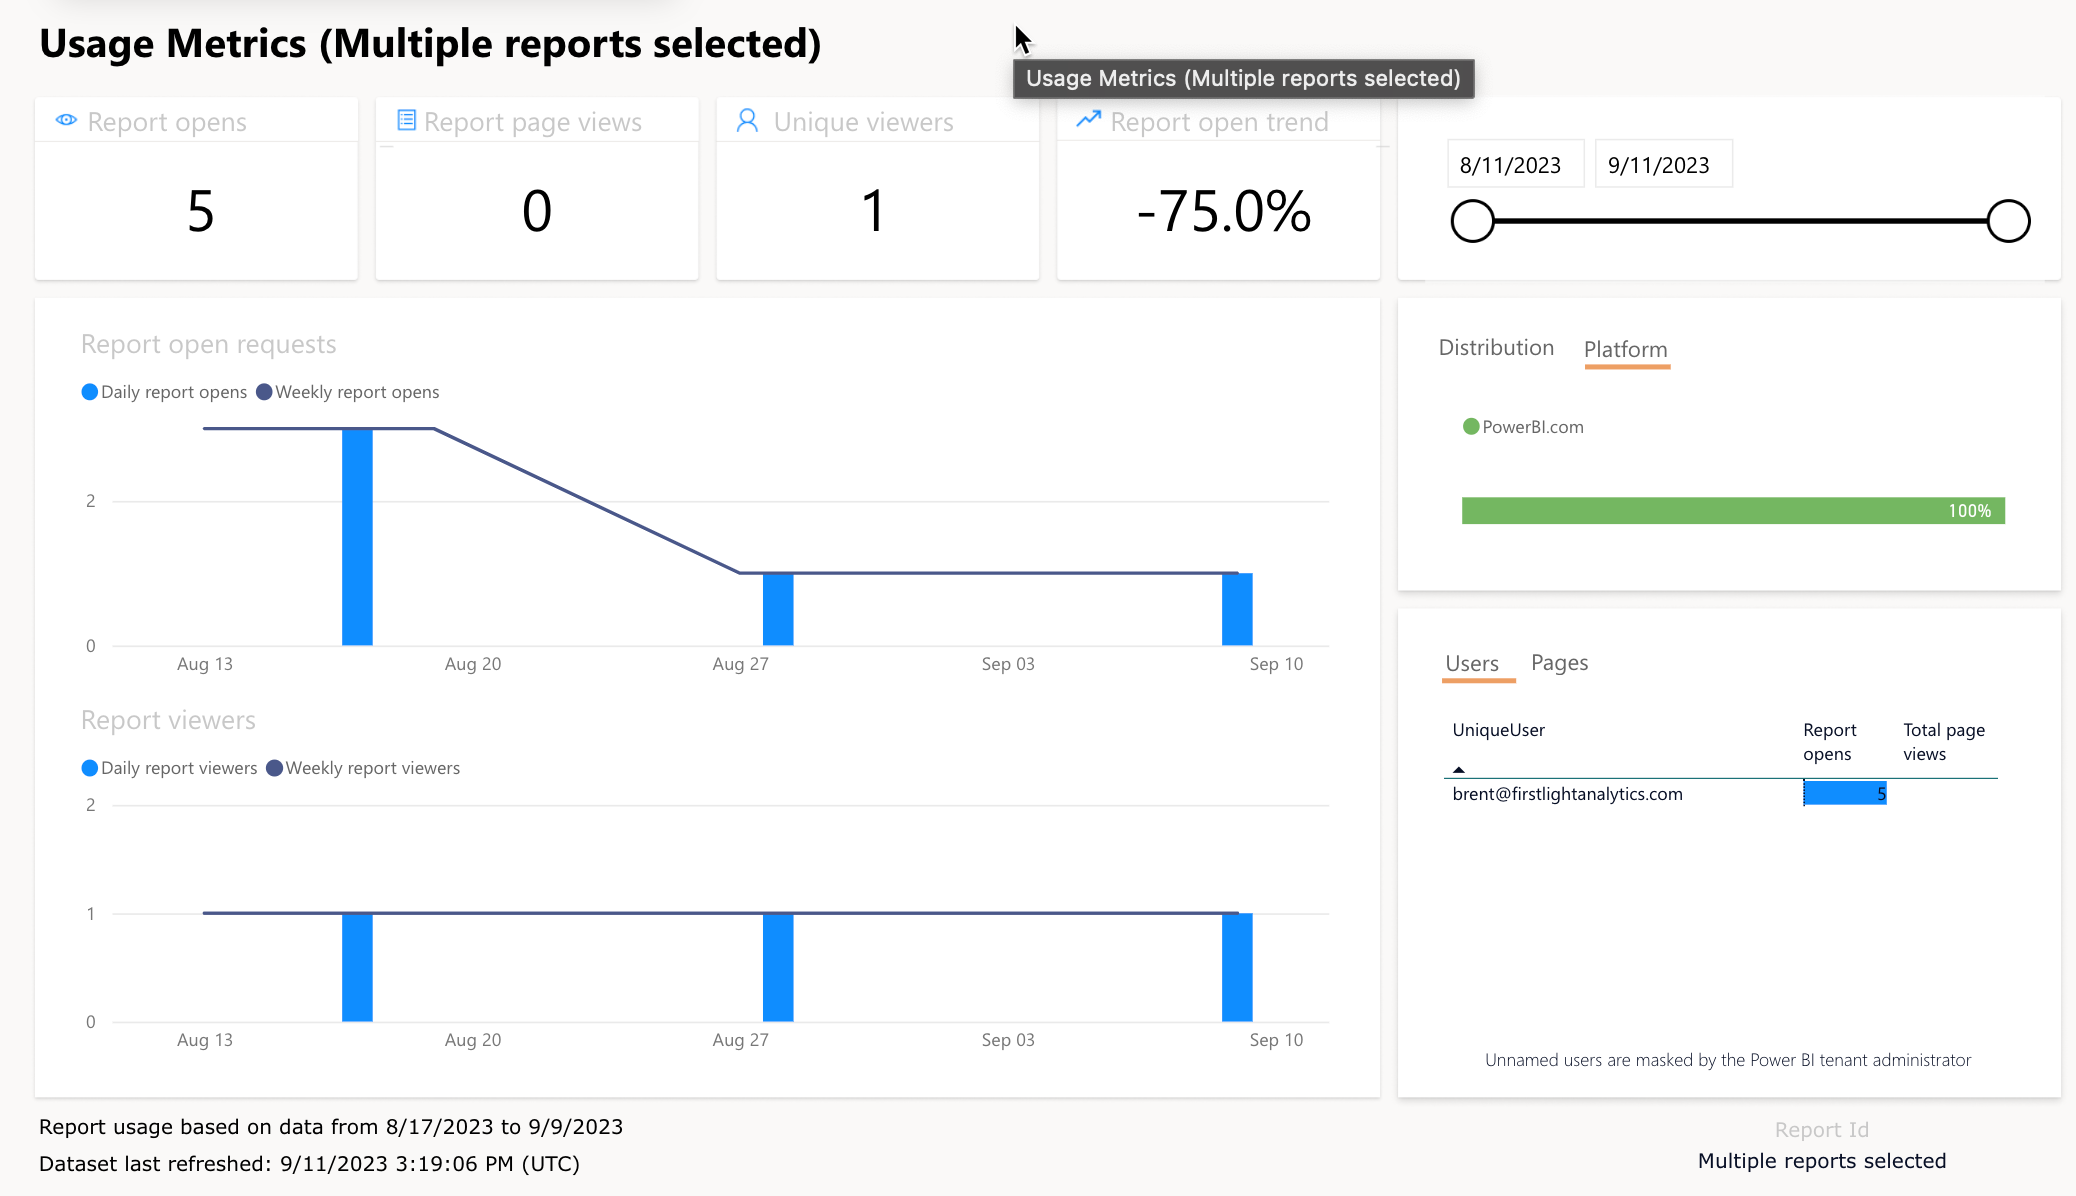
Because the usage metrics report is built on a standard (although hidden) Power BI dataset, it's also possible to build your own customized reports from that dataset. Just keep in mind that:
- The structure of this dataset is subject to change.
- This feature is currently still in preview.
- This dataset will only contain metrics for the single workspace in which it was created.
Limitations of built-in usage metrics
The built-in usage metrics are fabulous for being easy to set up for a single workspace, but they have limitations, too.
- They only span a single workspace you have access to. What if you want to get usage metrics across multiple workspaces, or someone's personal workspaces?
- They have to be initiated by hand. The metrics dataset has to be manually requested for each dataset. (Unless there was a way we could tell Power BI to go ahead and create a usage metrics dataset for every workspace? Hint: keep reading to find out.)
- You can only see them when you are a contributor or higher in a workspace. You may need to see these metrics for workspaces where you are just a viewer, or perhaps workspaces where you are not a member at all.
- They don't contain all the activity. Users do much more than simply view reports. They create, copy, export, delete. And the more features Fabric brings, that list of possibilities and types of objects will only continue to expand. How can we really understand everything our users are doing in the Power BI tenant?
- They don't give interaction level detail. In other words, you don't get a Google Analytics or deeper style level of interaction to know the visuals most interacted with or the specific ways in which the pages are used after they are viewed.
An open source solution to get usage metrics across workspaces
To address #1 and #2 above, Štěpán Rešl and Ioana Bouariu have created a useful open-source solution.
It works with the Power BI Service to get these datasets automatically created, then uses the Power BI API to pull their information into a centralized location. Stay tuned, he is working on a post to fully write up how to make this work in your organization and will posts it here on PowerBIOps.com.
For admins: The Feature Usage and Adoption Report
If you are an admin, you can address these challenges from above (#1) and usage dataset initiation (#2) challenges. For our admin-level workspace access challenge (#3), we can turn to the new features announced in May 2023, the Admin Monitoring workspace.
Still in preview, people with the Power BI Administrator role are given access to a special workspace called "Admin monitoring". They can then add other users whether those users are Power BI Administrators or not.
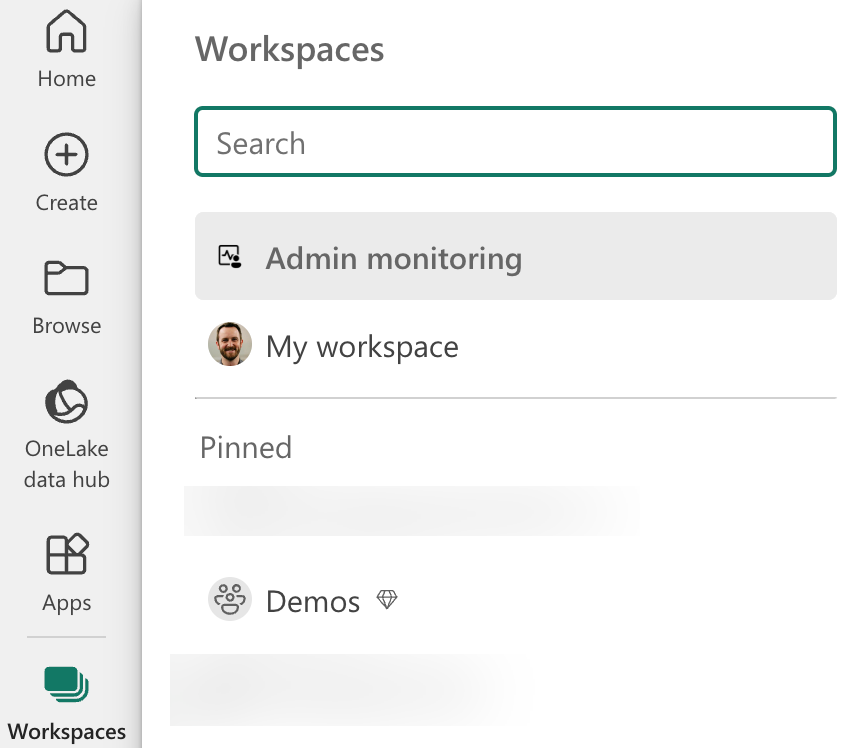
This workspace contains two reports and two datasets that are automatically created and populated by the Power BI Service.
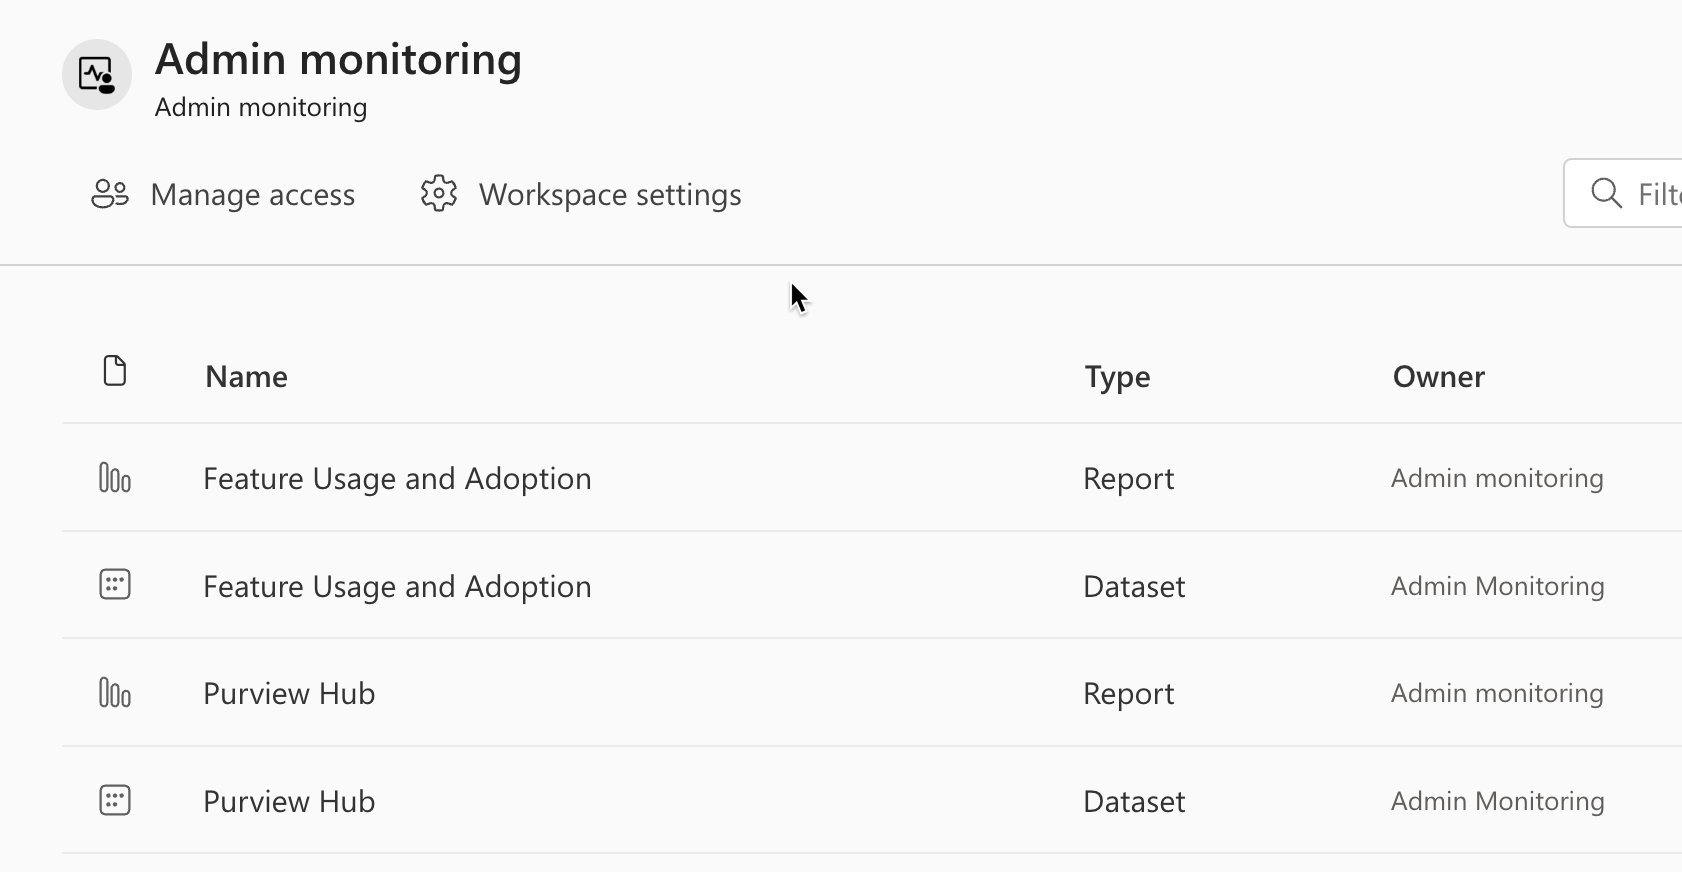
The Purview Hub report is more about the "Information protection and data loss prevention (DLP)" features of your Power BI data. But as an admin looking for User Activity, it's not very useful. Instead, let's check out the Feature Usage and Adoption report.
The Feature Usage and Adoption Report
This report can give you a good first blush at the kinds of activities happening in your tenant. It's summarizing data from the Power BI Activity Log for you into a Power BI dataset.
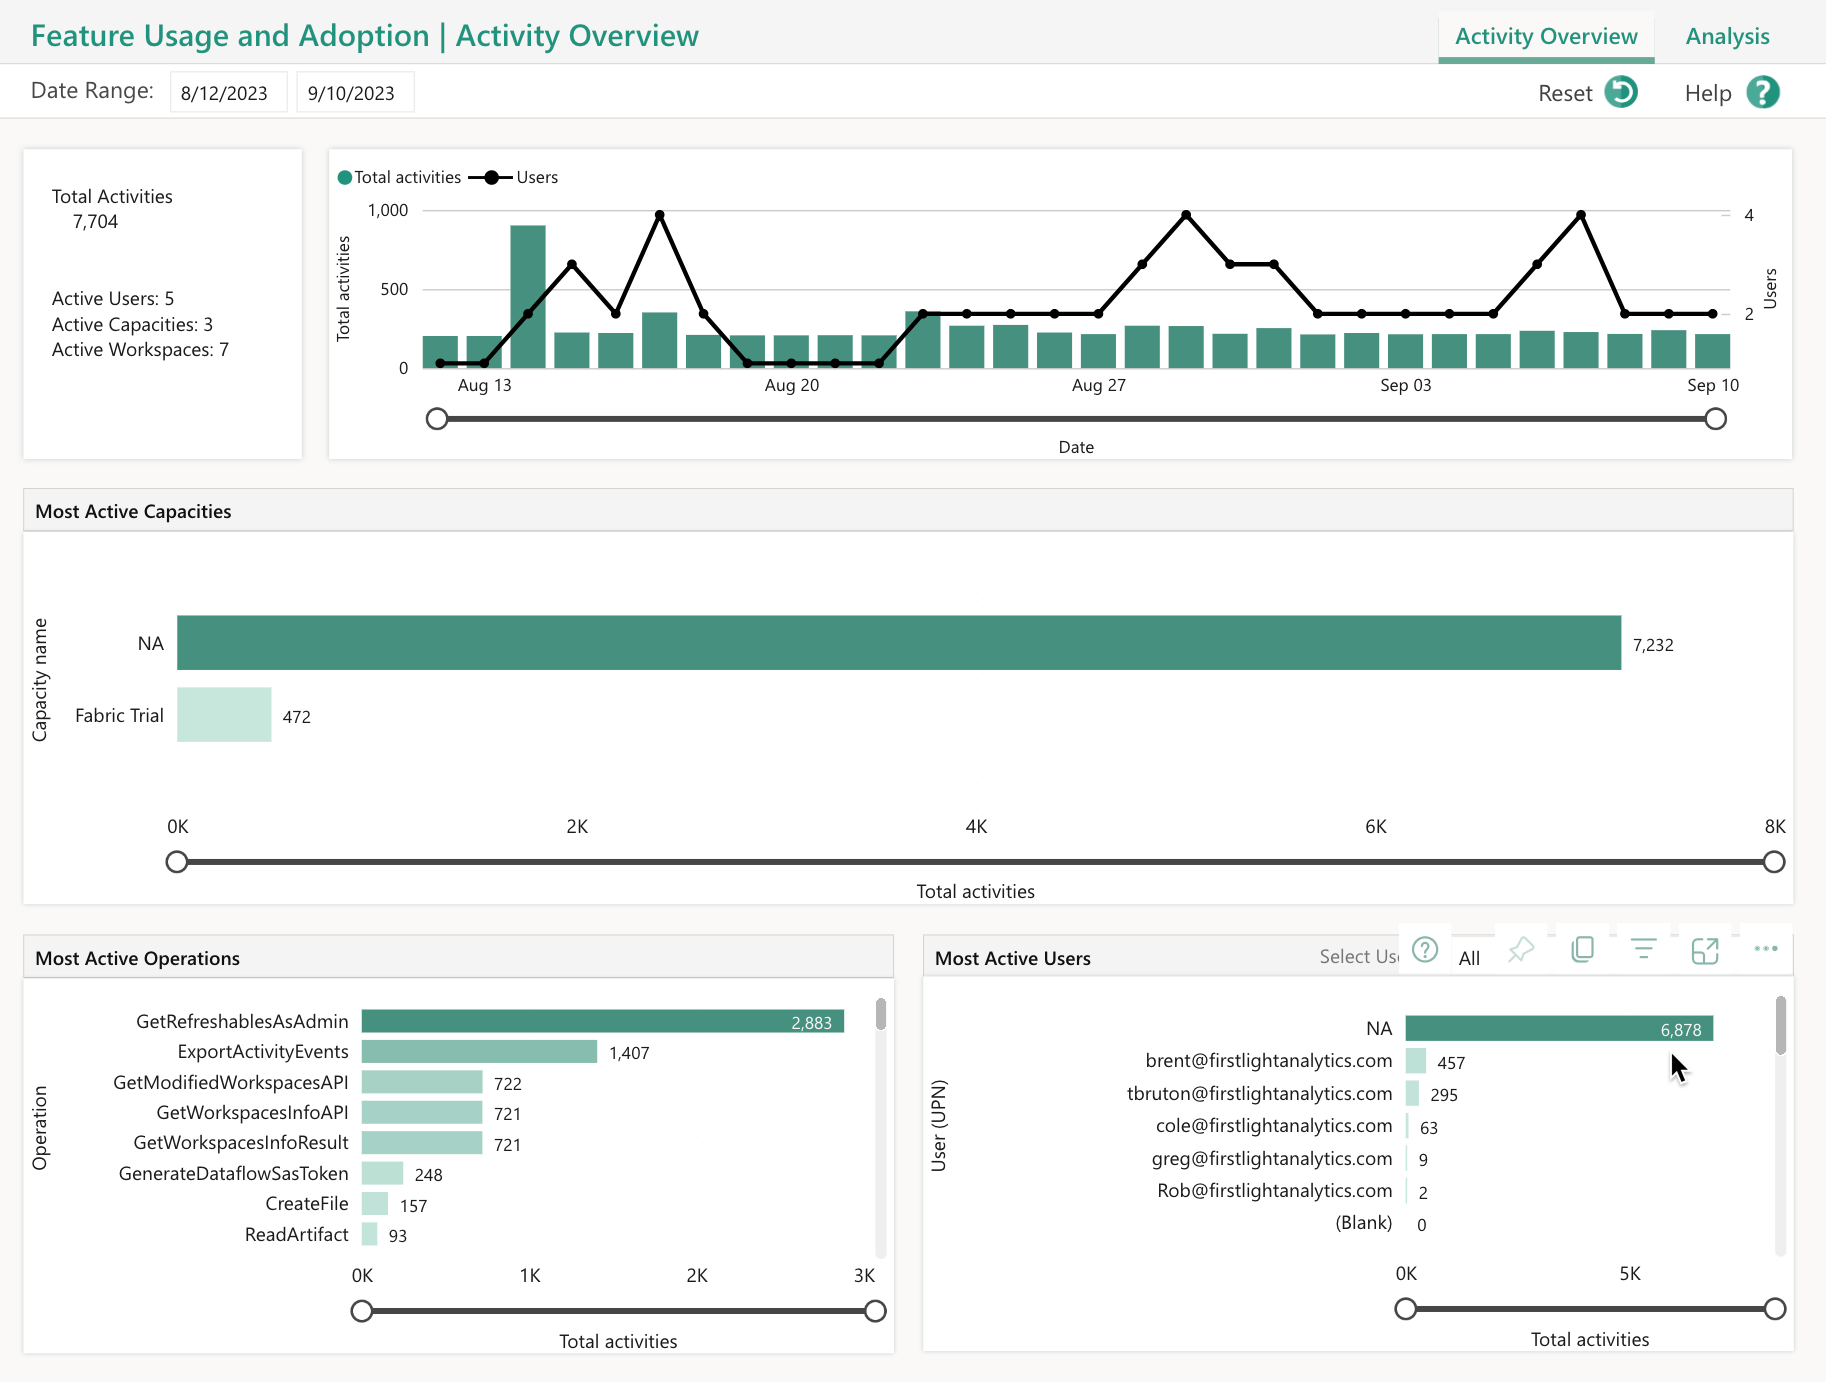
The page is mostly focused on "Activities", which truly represent anything that any user does in the report. Your capacities and users are also represented here along with the types of activities that are taking place.
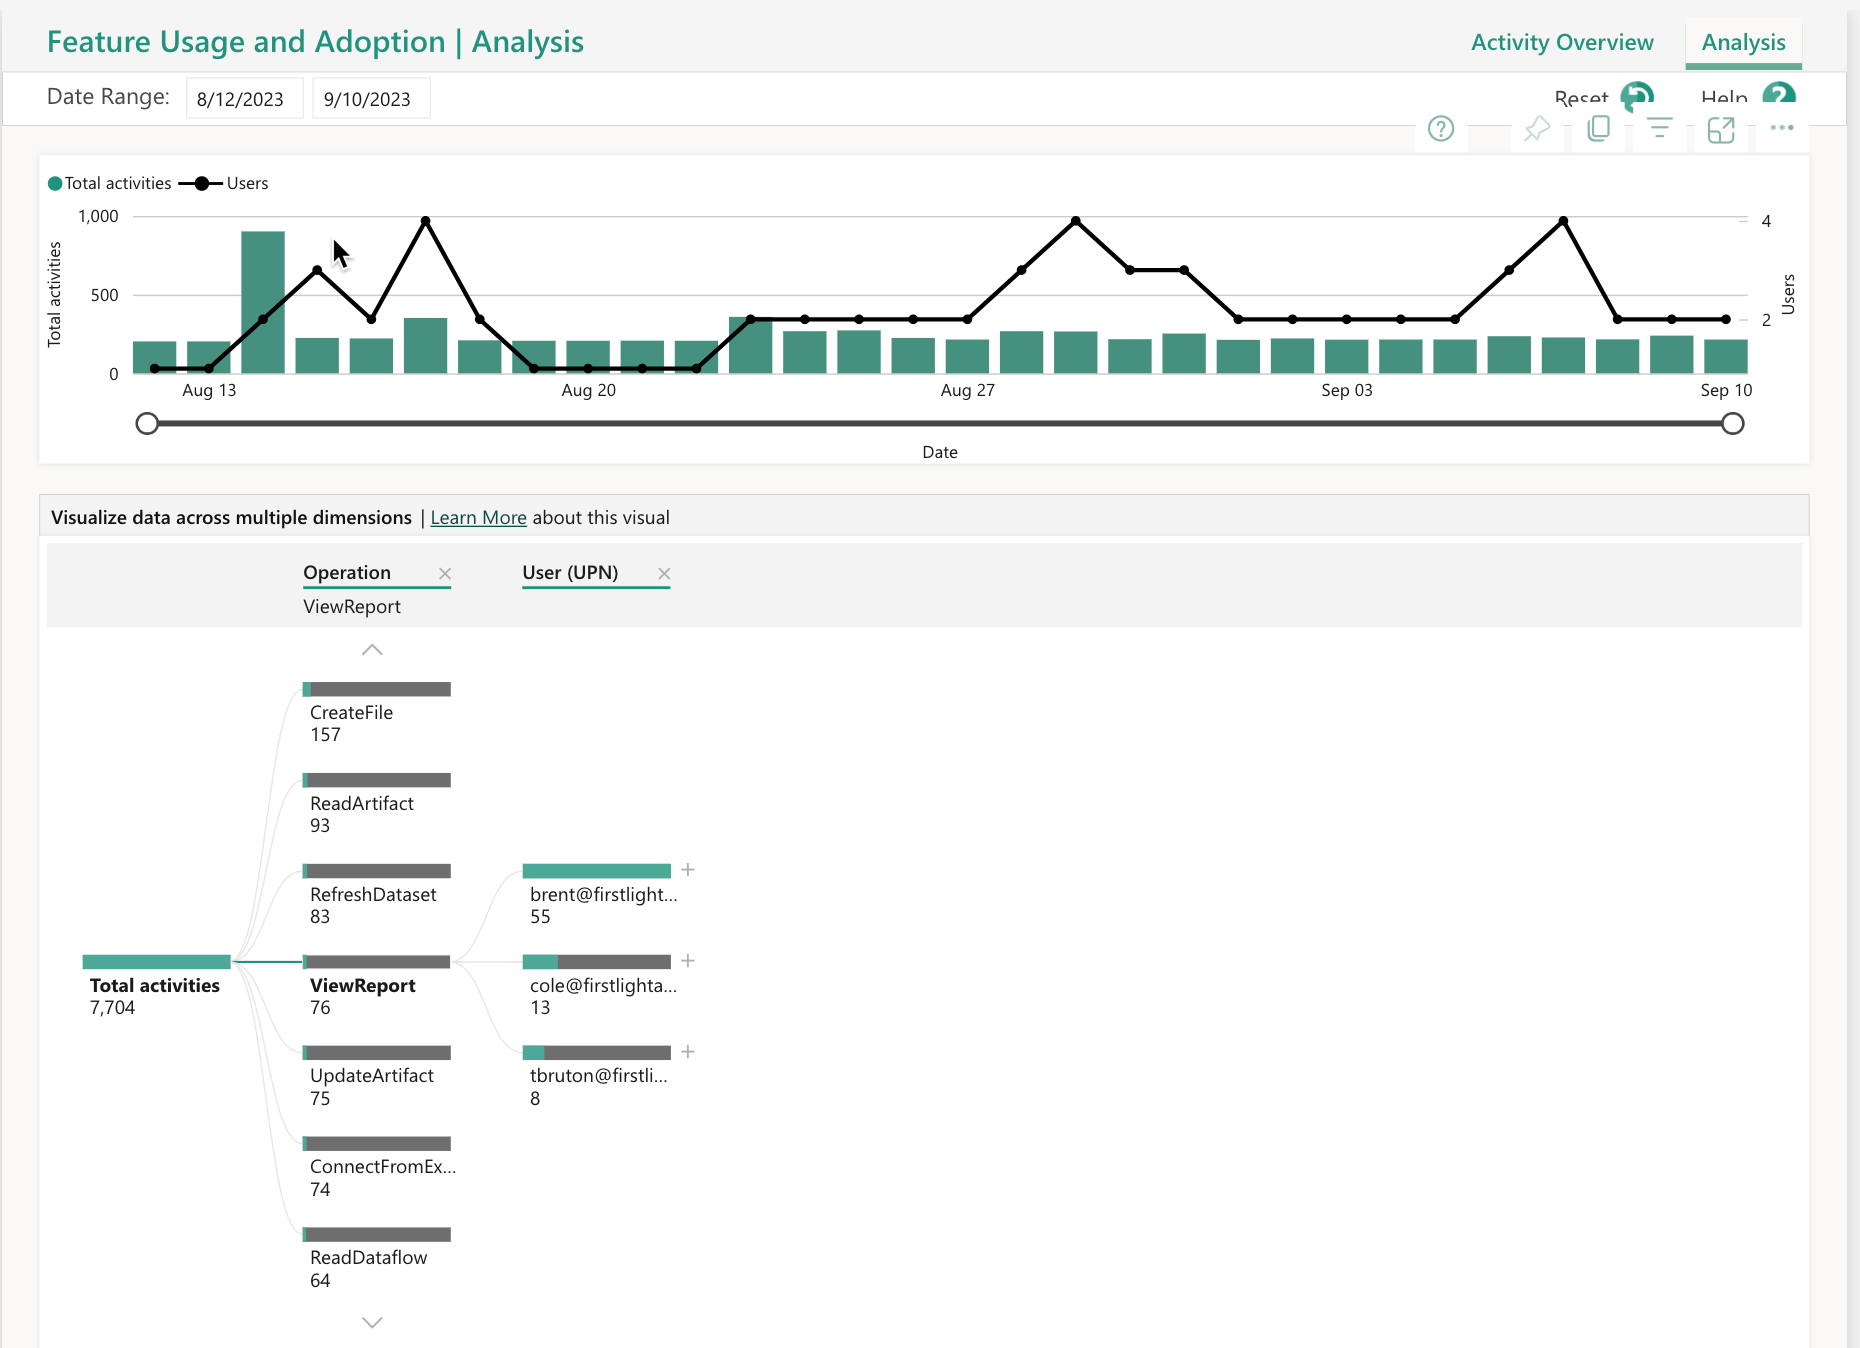
The "Analysis" page of the report gives a little more detail to tie together who is doing what. You can read here the official docs and full description of the how the report is built.
Make your own from the Feature Usage and Adoption Dataset
A great feature here is this report is built on a standard Power BI dataset. That means you can click "Save As" on the built-in report and start building a customized report of your own. Here's a look at the tables and columns available in this dataset.
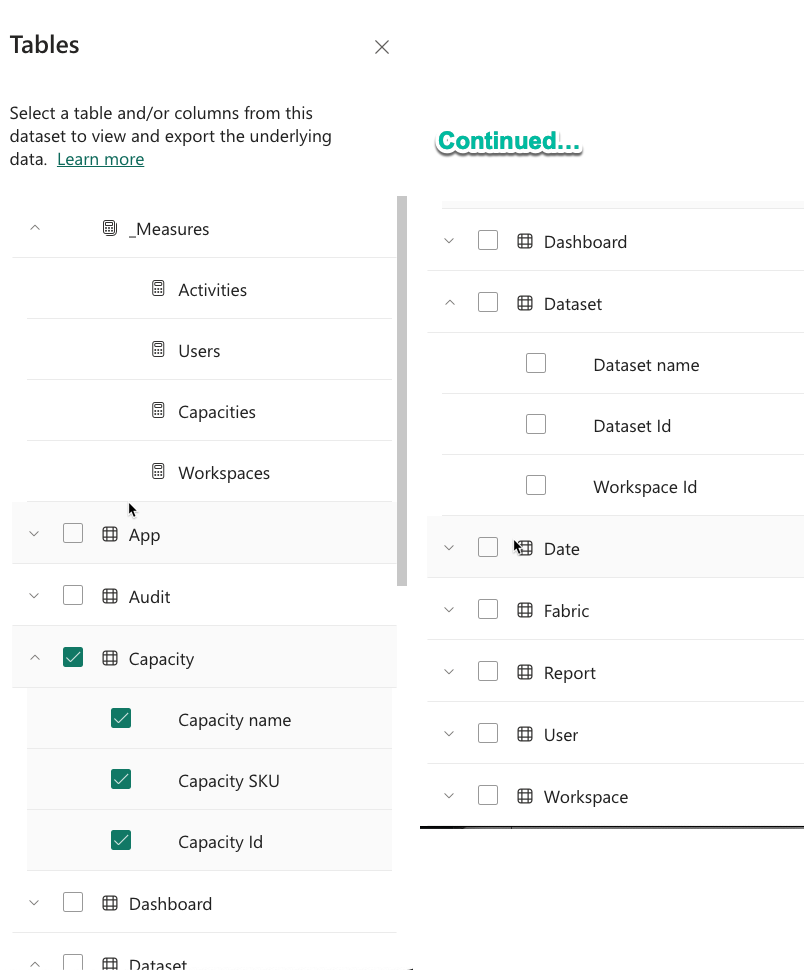
So it's a start, but we can notice a few limitations as well.
Caution - not all activities and data retention
As Fabric is rolling out, we have noted that sometimes certain kinds of activities are excluded from this report. This may be an issue that is addressed before the feature is released into GA. When I went to double-check the discrepancy we had found, it seemed to be resolved. But still, it's worth noting, you are relying on them to show you everything in this report.
Another limitation is that this data is only retained for 90 days. This is not just a limitation of the Power BI dataset, but of the Power BI activity log itself. If you really want to analyze this data for trending over any time period longer than 90 days, you need a strategy to persist and retain it somewhere you can access it later.
Finally, you can tell from the "_Measures" table that the dataset itself is fairly simple, with only 4 count measures in it. The dimension tables like "Capacity" are also fairly limited in their attributes, with only the identifying information about the capacity. You can see where you would want to supplement this report with more information, such as dividing your shared capacities from your dedicated capacities. Or getting a lot more information about users.
Where the real logs are - The Power BI activities API
While the Feature Usage and Adoption Report is a great starting point for how Power BI is being used in your organization, it still doesn't deliver to you all of the real User Activity in Power BI (see challenge #4). It also has time limitations for data retention; it will only show you the last 90 days of activity.
To complete the picture, we need to store data from the Power BI Activity Log, a subset of the Unified Audit Log with special permissions applied. That will be covered in detail in Part 2 of this article, scheduled for publish on September 19th, 2023. This can give you the complete picture of everything everyone are doing inside of your Power BI Tenant.
References
- Official Microsoft Docs on modern usage metric experience
- Power BI Activity Log docs
- Microsoft docs: Monitor usage in workspaces
- Blog announcement on the Admin Monitoring workspace
- Microsoft docs: Feature usage and adoption report and dataset
Sponsored: Argus PBI
If you would like tenant-wide User Activity reporting with no set up, longer retention periods, and all activities included, check out Argus PBI. Disclosure: the author is a partner and co-developer of this product.


